This week there has been a lot of discussion about the progression of the coronavirus epidemic in the UK. After a lull over the summer months, all the numbers seem to be increasing. Does this mean we’re in a second wave?
On Monday (21 September) Chris Whitty, the Government’s Chief Medical Officer, and Patrick Vallance, the Government’s Chief Scientific Adviser, gave an update on all the data they’ve been looking at in order to advise the Government on coronavirus in the UK. They discussed information from tests that people are taking if they feel unwell with coronavirus symptoms, as well as information from scientific studies, the numbers of people being hospitalised and the numbers of deaths from coronavirus.
All these sources of information are now suggesting the same thing – that we are currently seeing exponential growth in coronavirus in the UK.
What is exponential growth and why is it happening?
You may have heard people referring to ‘doubling time’ and ‘exponential growth’, and the Prime Minister mentioning ‘geometric progression’. All these terms are different ways of discussing the same thing – the fact that, as long as the coronavirus reproduction number, R, remains steadily above 1 we can expect to see the numbers of people with coronavirus increase in a particular way.
In an epidemic we don’t get a steady increase in the numbers of people with a disease; we get an increase in numbers that accelerates and accelerates until the point at which R is lowered. R can be lowered through preventative measures, because there aren’t sufficient people left who’ve not yet had the disease, or when a vaccine is introduced. This accelerating increase is called exponential growth.
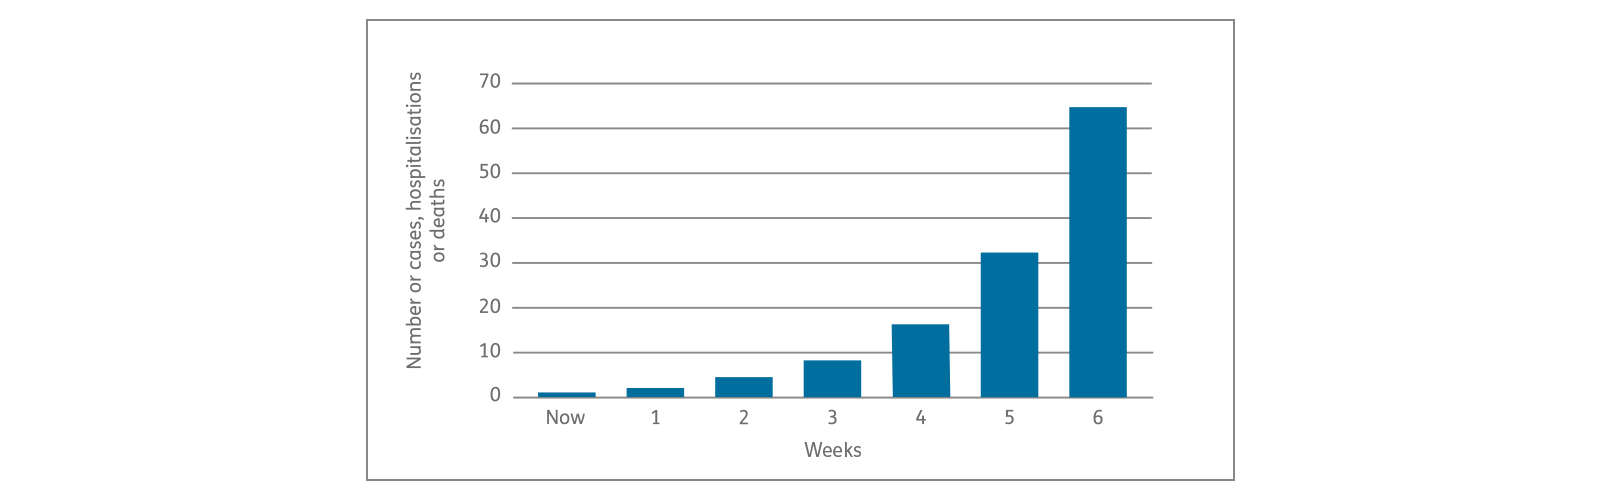
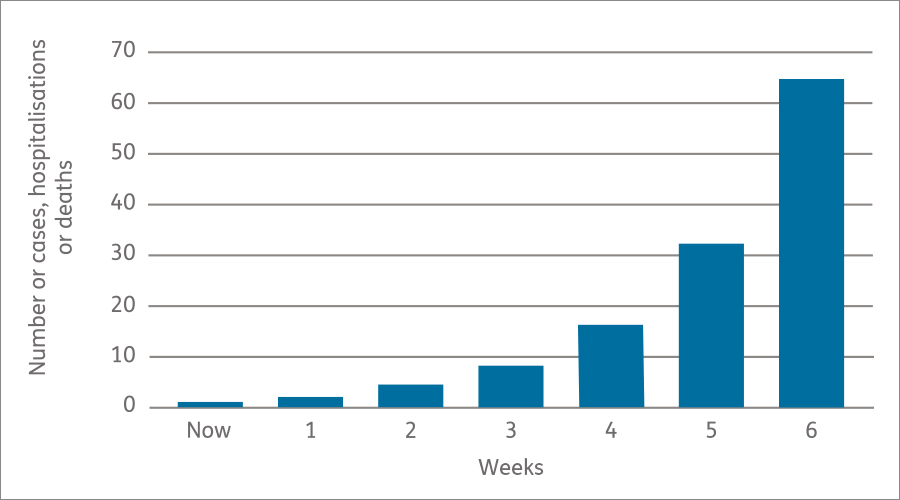
The doubling time is the period it takes for the numbers – of cases, of hospitalisation or of deaths – to double. At the beginning of the first wave of the coronavirus epidemic in the UK, when we weren’t taking preventative measures like social distancing and wearing masks, R was about 3 and the doubling time was about 3 days. Although the numbers of people with coronavirus are now increasing again, thankfully those preventative measures mean that R is lower – currently between about 1.1 and 1.4 – and the doubling time is therefore longer – about 7 days.
That means that, unless something changes, each week we can expect the number of cases, hospitalisations and deaths due to coronavirus to double. The graph below shows what this means. For each new case of coronavirus there is today, a week from now we can expect there to be 2 new cases a day. After 2 weeks there will be 4 new cases a day for each case now; after 3 weeks there will be 8, and after 4 weeks there will be 16 new cases a day – and so on. At first, exponential growth looks slow and steady, but if it continues it becomes alarmingly quick.
Will there be 50,000 new cases a day in October?
On 21 September, Patrick Vallance mentioned what could happen if we don’t change our activities at all. He said we could see almost 50,000 new cases of coronavirus each day by the middle of October. Vallance stressed that this wasn’t a prediction, but an illustration of what is possible.
50,000 cases a day may sound dramatic, but this is exactly what would happen if the doubling time were to stay at 7 days. Vallance was using real data from testing, which on the 15 September indicated there were 3,105 new cases of coronavirus. If the doubling time stayed the same, 1 week later there could be double this number – 6,210 new cases in a day. In another week there would be 12,420, then 24,840. And after 4 weeks, in the middle of October, there would be 49,680 new cases in a day – almost 50,000.
So what can we do?
Clearly 50,000 new cases a day of coronavirus isn’t what we want to see. Even with the improvements we’ve seen over the last 6 months in the ways hospitals are able to care for people with coronavirus, estimates suggest that it leads to the death of around 5 in every 1,000 people who have it. If 50,000 people did catch coronavirus in a single day in the UK, we could expect that to lead to the deaths of around 250 of them.
In order to prevent this situation, we need to increase the doubling time of the epidemic in order to slow the acceleration of the numbers of cases, hospitalisations and deaths. To do this we need to reduce the reproduction number by taking more preventative measures to reduce our chances of catching it, and reduce our chances of passing it on if we do catch it.
The data suggest that we are at the beginning of the second wave of coronavirus. If we all take measures to reduce the spread of the virus, together we can ensure that the second wave is not as severe as the first. Until there is a vaccine or a treatment that vastly reduces the proportion of people coronavirus kills, we will need to hold off from returning to living exactly as we did before the coronavirus pandemic, or we risk large numbers of deaths, particularly in older people.

More articles by Dr Webb
Dr Elizabeth Webb is a Senior Research Manager at Age UK. She has an MSc in Epidemiology from the London School of Hygiene and Tropical Medicine and a PhD in Social Epidemiology from University College London.